Support CleanTechnica’s work through a Substack subscription or on Stripe.
The United States is not exactly a world leader in electric vehicles, as we know by now. More than half of new car sales in China are plugin electric cars (full electrics or plugin hybrids), and 27% of new car sales in Europe are plugin electric cars. In the US, we are below 10%, with a drop in EV share coming recently after a long climb toward 10%.
If that wasn’t bad enough — the US getting solidly walloped by its “peers” in the transition to the electric auto industry of the future — some South American and Asian countries have actually gone and surpassed the US in this EV market share metric. The US, the home of Tesla, the Chevy Bolt, the Ford Mustang Mach-E, is now trailing several smaller nations without big incumbent auto industries.
But even knowing all of that, I was not prepared for the chart I was going to run across in T&E’s latest report, “EV progress report: Which EU carmakers are on track for 2025–27 targets?” The chart indicates that a whopping 42% of new car sales in Vietnam are now electric car sales! And that’s pure electric car sales. That even beats China! (30.2% full electrics.) Not as stunning, but still levels above the United States, Thailand is at 24.4% EV share. The time period for these figures is the first half of 2025. The US in that time period was at 7.47% EV share.
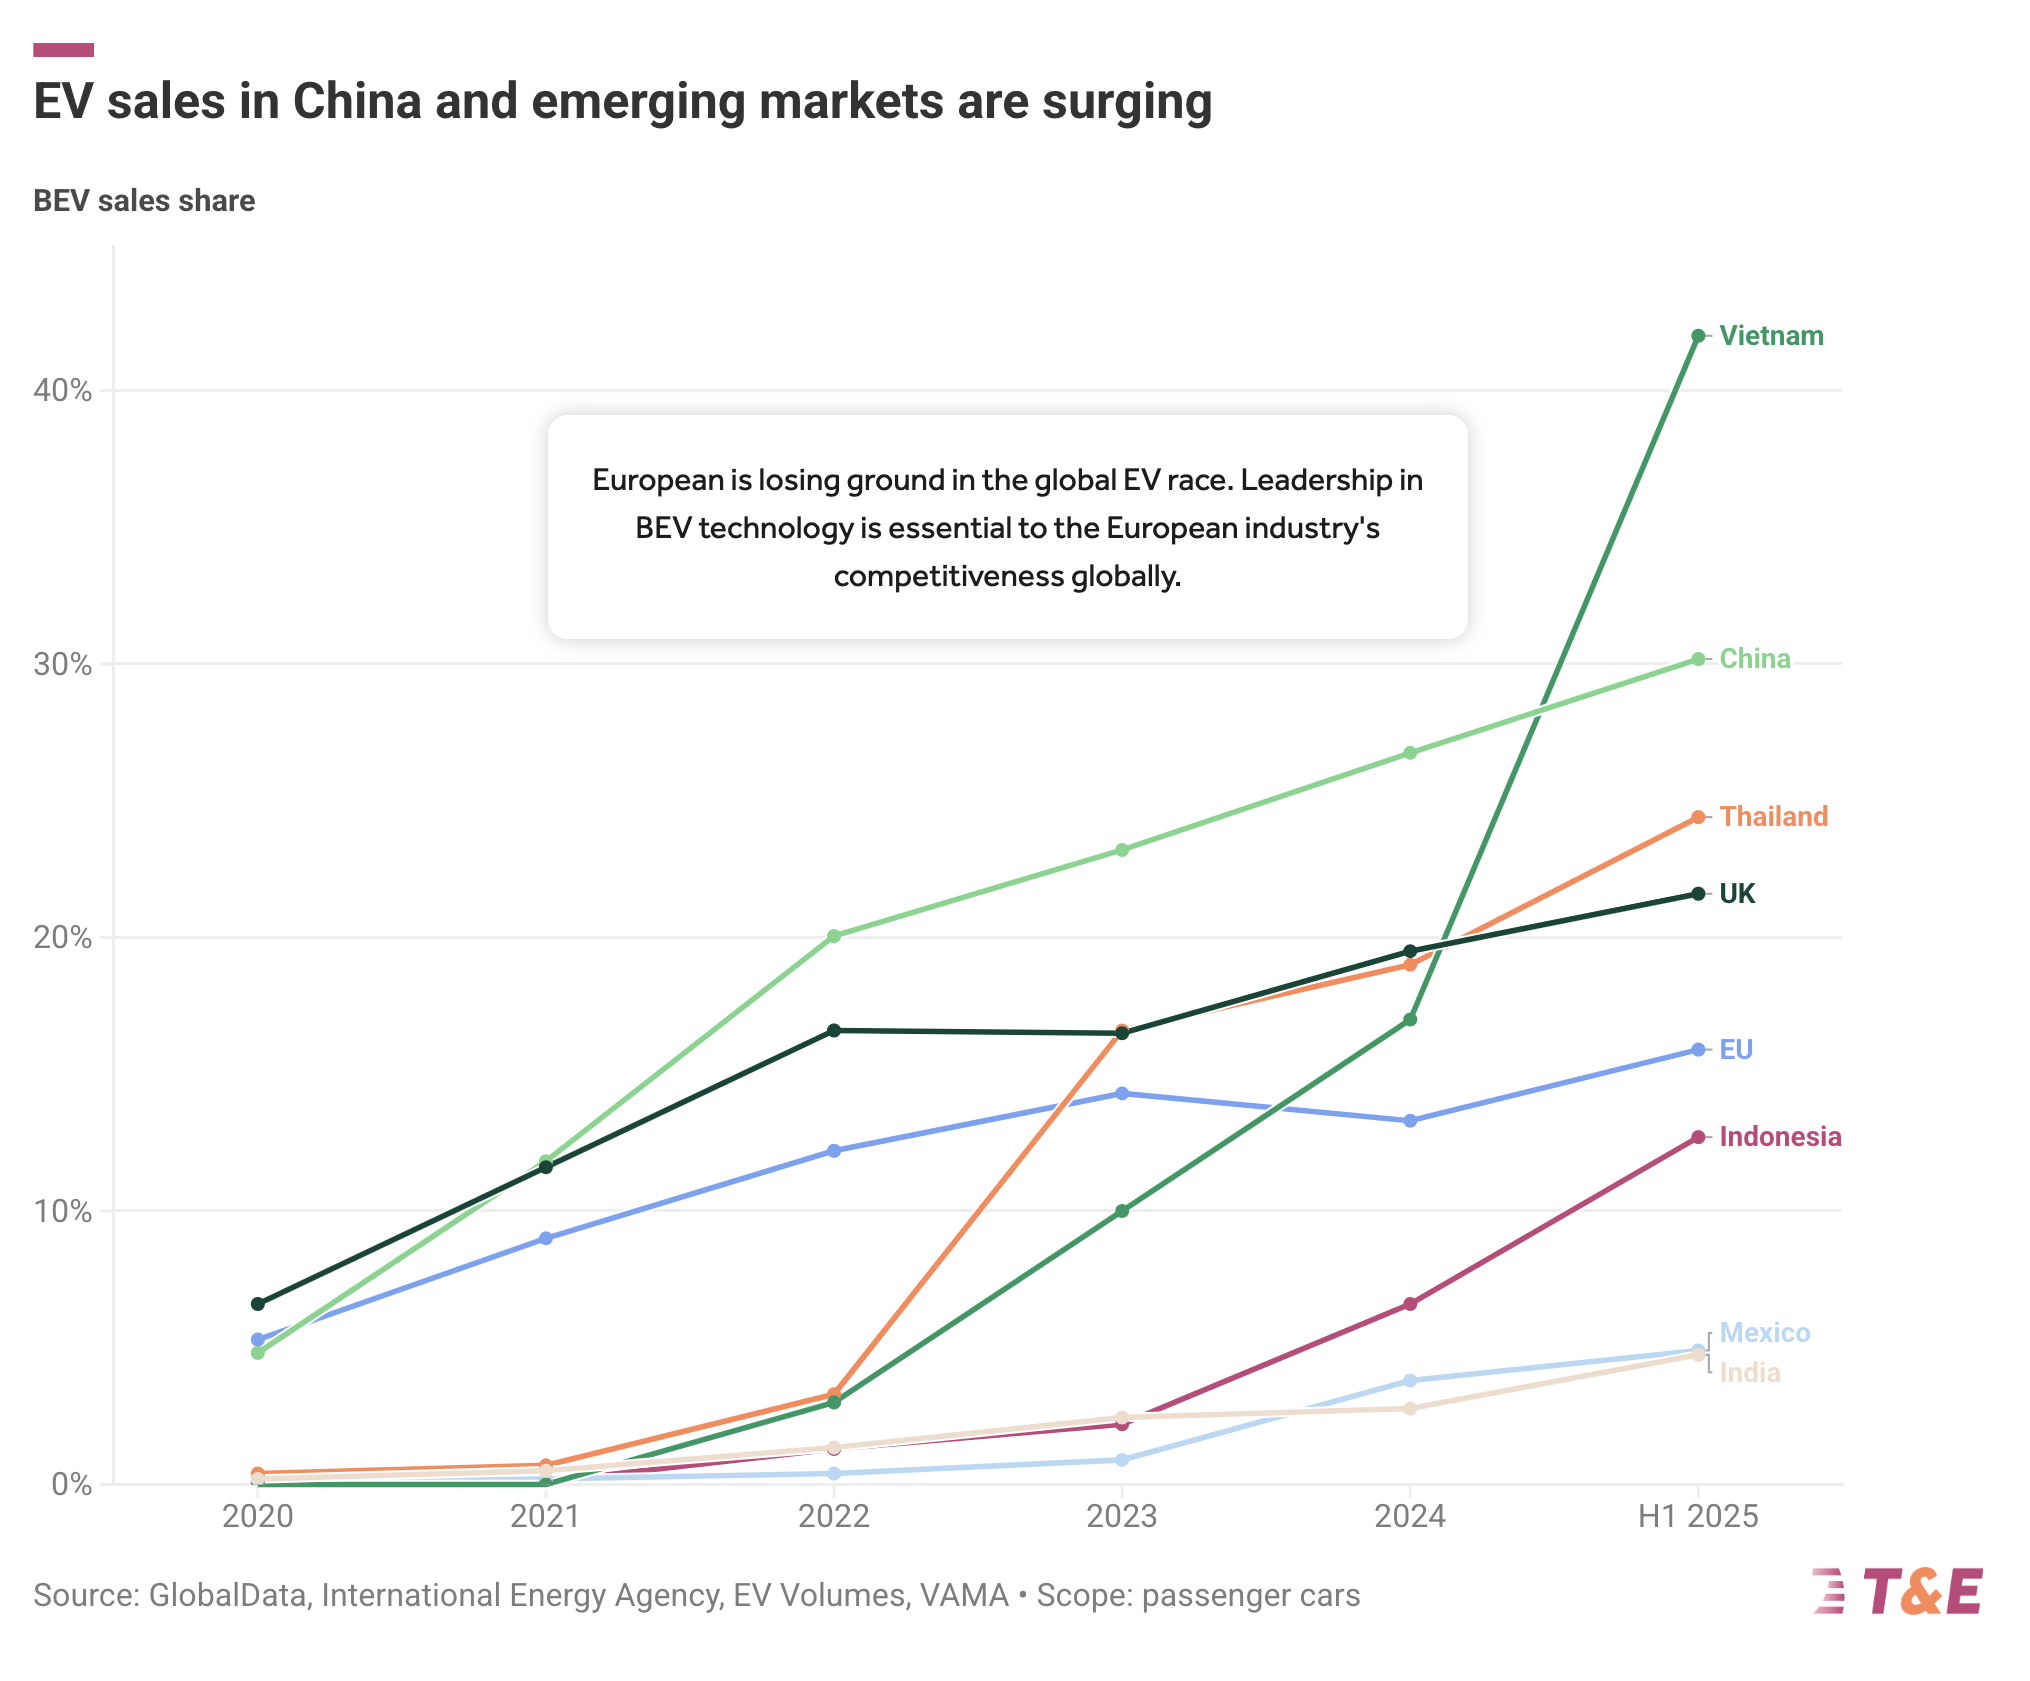
Further down, but still well above the United States, the UK is at 21.6%, the EU is at 15.9%, and Indonesia is at 12.7%. How embarrassing is that from a US perspective?
There’s another related graph in the report, but this one is a little tougher to read, and is certainly not as intuitive.
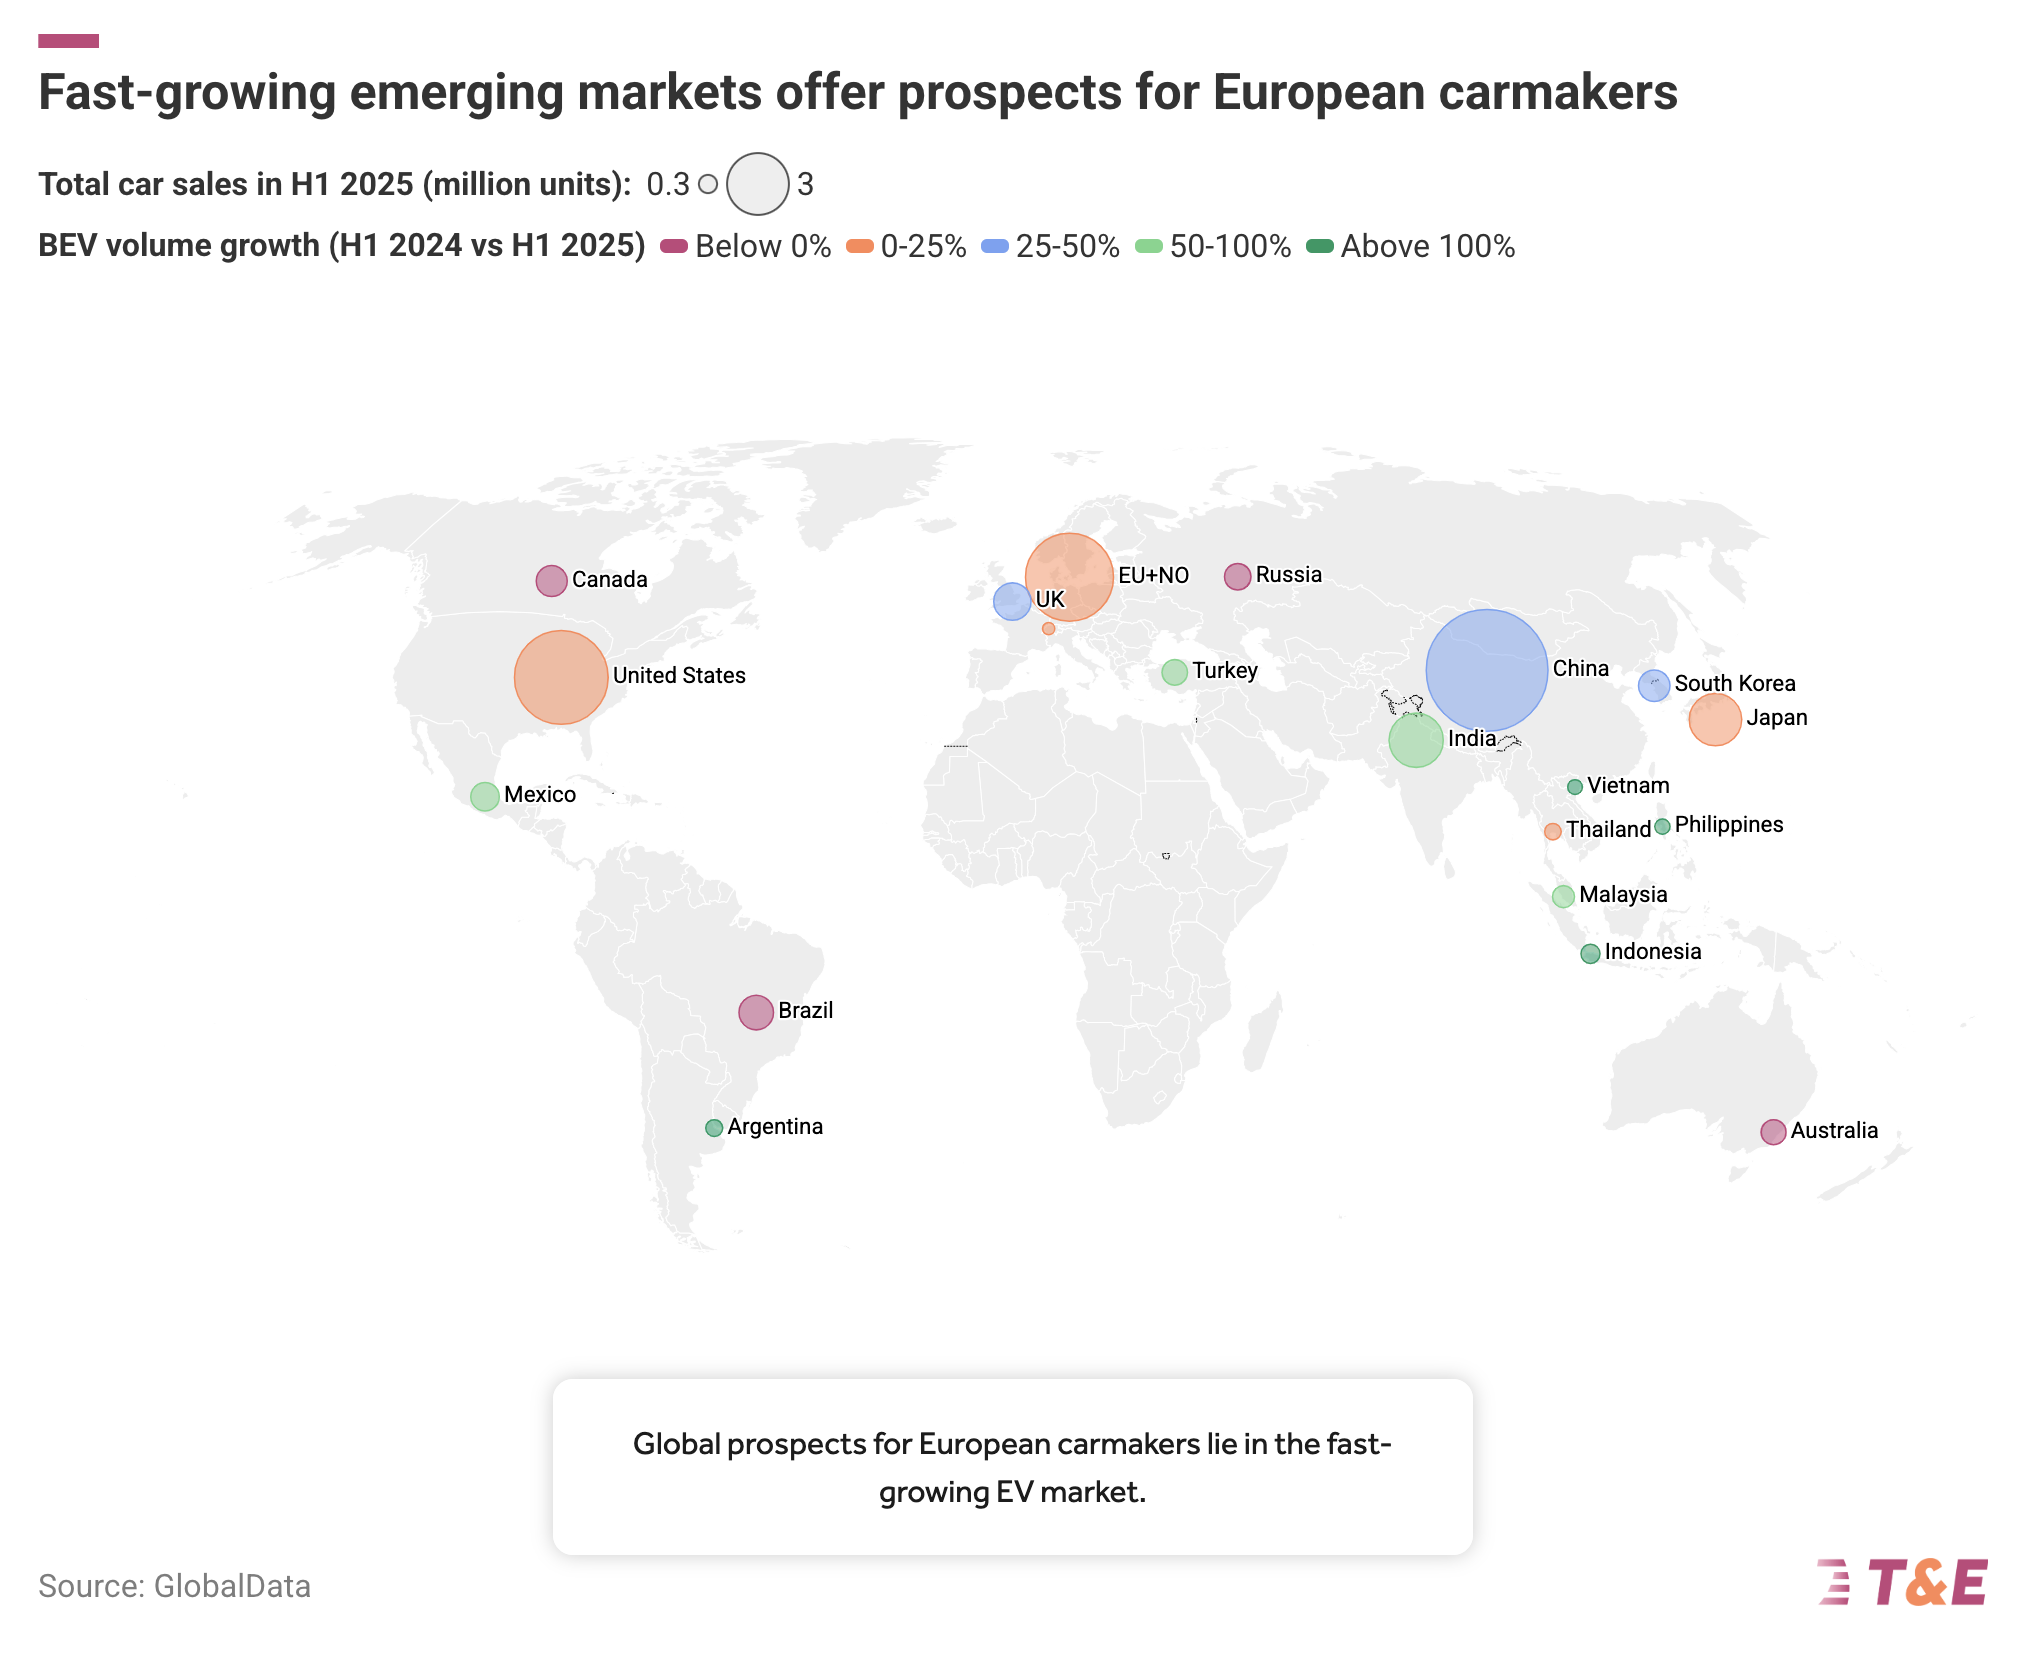
So, first of all, note that the size of the circles don’t relate to EVs — they represent the overall size of those auto markets (in the 1st half of 2025). So, yes, don’t be fooled and think the US is leading at anything.
The key thing to show how well electric vehicles are doing in these markets is the color of the circles. Those colors indicate how much BEV volume growth those markets saw. As you can see, green is best with either 50–10% BEV volume growth (light green) or +100% BEV volume growth (dark green). Yes, I think they should have used two different colors for those rather than different shades of green, especially with such small circles, but it is what it is.
What we see from this graph is that a number of countries in Asia are seeing wicked fast BEV sales growth. That includes Indonesia, Vietnam, the Philippines, Malaysia, and India. Naturally, three of those markets were highlighted higher up. One might first think that China’s EV producers are quickly spreading out in the region and bumping up these numbers, and that’s partly true, but you’ve also got Vietnam’s VinFast, Tata Motors in India, and some other non-Chinese brands doing well.
I guess the good news from an American perspective is that we’re not in the red. But we’re certainly in the laggards camp rather than the leaders camp. Thank goodness we have many other countries now leading in this important market of the future.
Sign up for CleanTechnica’s Weekly Substack for Zach and Scott’s in-depth analyses and high level summaries, sign up for our daily newsletter, and follow us on Google News!
Have a tip for CleanTechnica? Want to advertise? Want to suggest a guest for our CleanTech Talk podcast? Contact us here.
Sign up for our daily newsletter for 15 new cleantech stories a day. Or sign up for our weekly one on top stories of the week if daily is too frequent.
CleanTechnica uses affiliate links. See our policy here.
CleanTechnica’s Comment Policy